In
this blog I’m going to introduce you to the mathematical model that shows how
temperature affects reaction rate.
You
probably learned from your earliest days in chemistry that temperature affects
reaction rate
Many
young students think that if they heat a reaction in a test-tube more/hotter
the reaction will go faster.
These
young students aren’t sure why the reaction should go faster they seem just
intuitively to know that the reaction will go faster.
And
for the most part reactions do go faster at higher temperatures.
So
what might be going on in the reaction mix?
Collision Theory
That
brings us to think about collision theory.
Can
a reaction between substances take place without their particles “colliding”?
The
answer is no, in collision theory the fundamental assumption about chemical
change is that it takes place between two, not necessarily different, particles
colliding.
Each
collision is also assumed to be between just two particles because the chances
of three colliding at the same time are very remote.
The
only other way a reaction might start is for one particle to split into
two.
Collision
theory also suggests that not all collisions are effective at bringing about chemical
change.
Think
about collisions between vehicles on the road.
Vehicles
can collide head–on or they can collide sideways, one car hitting the side of
the other or they can just make glancing blows with very little if any damage
or even a head on collision can cause no damage if it is at a very slow
speed.
Transfer
those ideas to particles in a chemical reaction and you see that the biggest
assumptions in collision theory are that effective collisions
a)
occur when particles have sufficient energy to collide and break bonds: the
activation energy
b)
have to have the particles in the correct orientation to each other in space.
There
is then an energy barrier to
effective collision between particles and therefore to reaction taking place.
This
energy barrier to reaction is called the Activation Energy EA

This
chart shows how activation energy can be a barrier to reaction.
So
how many particles in a reaction mix actually have the activation energy?
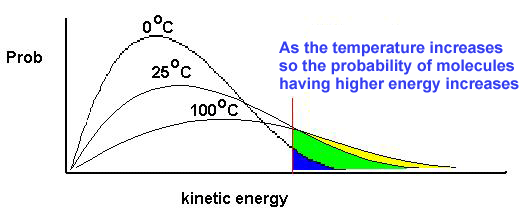
This
chart shows how gas molecules are distributed over different kinetic energies
at two temperatures: T1 K and a hotter temperature T2 K.

What
does this chart tell us?
First,
the area under each curve is the same because it represents the number of gas
molecules in the reaction mixture.
This
number does not change as the temperature rises.
Second,
as the temperature of the gas rises more molecules occupy higher energy states
so the most occupied value (the peak of each curve) drops and moves right to a
higher energy value.
Third,
two activation energies are marked on the graph. Ea1 and Ea2. What you notice is that at the higher
temperature there are more molecules at or above the activation energy.
So
at higher temperatures reactions tend to go faster because there are more
particles that possess an energy at or greater than the activation energy.
The
chart below summarises these points
Arrhenius
suggested that the effect of temperature on the rate of a reaction depended on
the activation energy of the reaction in this mathematical relationship:
k = A
e –Ea/RT
where
k
the rate constant
A
a factor associated with the
orientation of the particles on reaction and their collision frequency
Ea
the activation energy (J.mol-1)
R
the universal gas constant (8.314
J.mol-1.K-1)
T
the temperature of the reaction (K)
Taking
natural logs of this relationship yields a relationship in the form of y = mx +
c thus:
ln
k =
ln A – Ea/RT
so
that a plot of ln k vs 1/T yields a straight line with gradient –Ea/R and an intercept
corresponding to ln A.
Here
are the results from an experiment to determine the activation energy for the
iodination of propanone.

How
do we calculate the activation energy?
First,
the temperatures for each experiment have been converted in to Kelvin by adding
273.
Second,
the inverse of these Kelvin temperatures have been calculated.
Third,
the natural log of the rate data has been determined using the spreadsheet ‘ln’
function.
Fourth,
it then becomes relatively simple to produce an x-y scatter plot of the
ln(rate) data vs 1/T.
Fifth,
adding the trendline and its equation gives the gradient of the line from which
the activation energy can be calculated as follows:
Gradient
is –6458 = –Ea/R
Therefore: Ea =
6458 × 8.314 J.mol–1
= 53.7 kJ.mol–1
I’ve
added below the script for an experiment in which you can determine the
activation energy for the bromate/bromide reaction.
You
can try this out in the lab it’s different because it uses phenol and methyl
red and is a clock reaction.
See
what you think.
Investigating the
effect of temperature on the rate of reaction between bromide and bromate
ions.
Introduction
The reaction
to be studied in this experiment is between bromate(V) and bromide ions in the
presence of acid and occurs according to the equation:
KBrO3 + 5KBr
+ 3H2SO4 =
3K2SO4
+ 3H2O + 3Br2 [1]
In this
reaction, the potassium and sulphate ions are “spectator” ions in that they are
not themselves materially affected, so, in ionic terms the reaction may be
summarised as,
BrO3- +
5Br- + 6H+ =
3Br2 + 3H2O [2]
The rate of
this reaction can be conveniently measured by measuring the rate at which
bromine is produced.
To do this,
a limited amount of phenol and the dye methyl red are added to the reaction
mixture, the bromine reacts very rapidly with the phenol to form 2,4,6–tribromophenol.

Once all the
phenol added has reacted there will be excess Br2 released by the
reaction.
This will oxidise
the methyl red causing the disappearance of the red colour in the reaction
mixture.
Thus, if the
time (t) taken for the red colour to disappear is measured from the start of
the reaction then this will closely correspond to the time taken for the
reaction to produce enough bromine to react with a known quantity of phenol.
Provided the
concentrations of the reactants are set at particular values then the rate of
reaction will depend only on temperature.
Also, if the
quantity of phenol added is kept the same, the value of the rate constant at a
given temperature will be proportional to t-1.
Thus by
measuring t at various temperatures we can calculate a value for the activation
energy (Ea) for the reaction. (see Equation 4 in the theory
section).
Experimental
Procedure
1. Pipette 10cm3 of the bromate(V)–bromide solution provided in
the laboratory and 10 cm3 of phenol solution into a 100ml conical
flask.
2. Place the flask in a large plastic trough of water at the temperature
(T) at which the reaction is to be run. (N.B. Place a thermometer in the flask
to determine as accurately as possible the actual reaction temperature. Ensure
that the thermometer bulb is covered by the solution).
3. Pipette 25 cm3 of 0.5M sulphuric acid into another 100ml
conical flask, add 10drops methyl red solution and stand the flask in the water
bath/trough.
4. When the solutions have reached the same steady temperature, add the
sulphuric acid/methyl red mix to the bromate(V)-bromide/phenol mixture and
start the stop clock.
5. Take the reaction mixture out of the water-bath/trough, stand the flask
on a white tile next to a reference flask containing water and shake gently
from time to time until the red coloration disappears.
6. Note the time (t) for this to occur and the final temperature of the
solution.
The procedure described above should be repeated at four different temperatures in the range 0oC to 65oC,
the reaction temperature and time taken for the colour change to occur in the
methyl red being carefully noted in each case.
Theory
If a chemical reaction is to take place between two reactive species,
these species must collide with each other in order that bond breaking and/or
making can lead to the formation of products.
In gas phase reactions, collisions between molecules are easily
envisaged.
In solution the reactive species are less free to move about, being
hindered by solvent molecules.
However, whether in the gas phase or solution it is clear that not every
collision is successful in bringing about reaction.
For example, in a gas at one atmosphere pressure and at room temperature
there are typically 1028 collisions per cubic centimeter per second.
Therefore, if all collisions were successful all gas phase reactions
would be over in about 10-9 seconds, which clearly does not happen.
Therefore there must be some other factor that operates to reduce the
effectiveness of collisions in bringing about reaction.
In order for a reaction to occur, it is not sufficient that molecules
simply collide, they must do so with enough energy.
The numerical value of the minimum energy is called the ACTIVATION
ENERGY (Ea) and is specific to a particular reaction.
In this experiment, you will calculate the activation energy for the
bromate(V)-bromide reaction.
The rates of most reactions are known to increase significantly with
rising temperature.
A good rule of thumb is that the rate roughly doubles for every 10oC
rise.
There are exceptions to this but on the whole it is a fair guide.
In 1889 Arrhenius proposed that the temperature dependence of the rate
of reaction is governed by the equation that now bears his name,
k = A exp
[-Ea/RT] [3]
where k is the rate constant, Ea is the activation energy, R is the gas
constant and T the temperature in degrees Kelvin.
The pre-exponential term A is the property of the particular reaction
related to the collision frequency of the reactive species.
We might thus expect A to be itself temperature dependent and this is
indeed the case.
However, in equation (2), the dependence of k on temperature is
dominated by the strong exponential term, so, in the analysis of experimental
data, the dependence of A on temperature is usually ignored as a first
approximation.
Equation (2)
can be rewritten in logarithmic form,
log10k
= log10A – Ea/2.303R
T [4]
[ y = c – m x ]
where R, the gas constant, is 8.314 J.mol-1K-1
A graph of log10k against 1/T is therefore expected to be
linear with negative slope given by –Ea/2.303R.
Measurement of a reaction rate at various temperatures therefore
provides us with a means of determining the activation energy for the reaction.
Questions
1. Complete this table
of the results of your experiments:
Expt
|
Temp /oC
|
Temp (T)
/K
|
1/T /K-1
|
Time (t)
/s
|
1/t /s-1
|
log10(1/t)
|
2.303 log10(1/t)
|
1.
|
|||||||
2.
|
|||||||
3.
|
|||||||
4.
|
|||||||
5.
|
|||||||
6.
|
2. Plot a graph of 2.303 log10k vs
1/T and determine from the slope the activation energy of the reaction.
3. Draw an energy profile of the reaction
between bromate(V) and bromide ions marking on your profile the enthalpy change
of the reaction (∆H) and the activation energy Ea.
4. Leave your final reaction mixture to stand
and note down and explain any changes you observe after 10-15 mins.


No comments:
Post a Comment