GCSE OCR Gateway Chemistry
C5.2a-d
C5.2 Controlling
reactions
Summary
Changing the
physical conditions of a chemical reaction can change its rate and yield.
Common
misconceptions
Learners often
misinterpret rate graphs and think that catalysts take part in reactions and
run out/get used up.
Underlying
knowledge and understanding
Learners should be
familiar with the action of catalysts in terms of rate of reaction. They should
know the term surface area and what it means.
Tiering
Statements
shown in bold type will only be tested in the Higher Tier paper.
All
other statements will be assessed in both Foundation and Higher Tier papers.
C5.2a To be able
to suggest practical methods for determining the rate of a given reaction
C5.2b To be able
to interpret rate of reaction graphs
C5.2c To be able
to describe the effect of changes in temperature, concentration, pressure, and
surface area on rate of reaction
C5.2d To be able
to explain the effects on rates of reaction of changes in temperature,
concentration and pressure in terms of frequency and energy of collision
between particles
Controlling Reactions
This is all
based on practical experimental work.
Let’s begin
looking at a particular chemical change and see how we can control its rate.
The reaction
we are going to examine is between magnesium and hydrochloric acid.
Equation: Mg
+ 2HCl ⟶
MgCl2 + H2
What we are
going to do is change the concentration of the hydrochloric acid we are using
and see how that affects the volume of hydrogen gas evolved over time.
The set up
we’d use might look like this:
Magnesium
ribbon reacts with hydrochloric acid to form hydrogen gas. One way of following the reaction is to
measure what volume of hydrogen has evolved every half minute until the
reaction stops.
In the
experiment discussed below, excess magnesium reacts with 1M hydrochloric acid
and then with 2M hydrochloric acid and in each case the results are
collected.
In practice
you would carry out the experiment with each acid concentration say three times
and find the average volume after each half minute. In this way, you increase the reliability of
your results. I’m presenting results on
the assumption that they are reliable and for the purpose of showing you how to
compare the effects of increasing the concentration of the acid.
Results
The results
look something like this:
First the
data
Then the
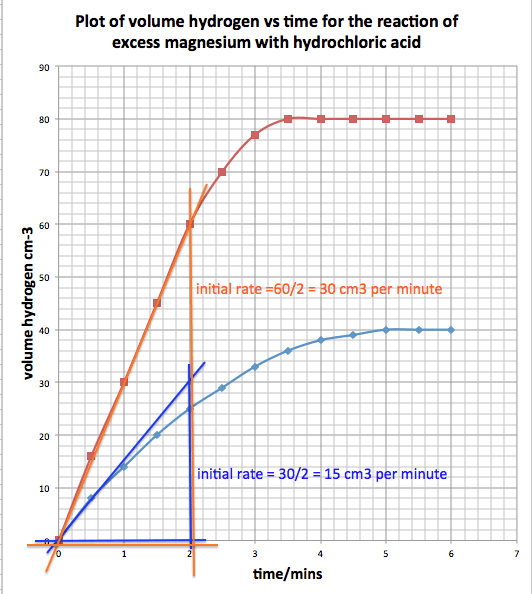
graph of the data:
These show
you how to tabulate the data you collect and how to draw the graph.
For the graph,
which is an X-Y scatter graph, the volume of hydrogen is the dependent variable
so it is put on the vertical axis.
The time
passing is the independent variable and that by convention is placed on the
horizontal axis.
The rate of
reaction changes as the reaction proceeds.
It is the
gradient of the line graph that tells you how fast the reaction is going at any
one time.
The reaction
is fastest at the start time t=0 mins.
The reaction
is slowest when it stops and the line is horizontal.
We are going
to measure the initial rate of each reaction: first for the 1M acid then for
the 2M acid.
To measure
the initial rate we take the tangent of the line graph at t=0.
These are
drawn on the graph below for 1M in blue and 2M in red.
We measure
the volume of gas evolved in 2minutes for the 1M acid and the 2M acid then we
calculate the initial rate of each reaction.
The results
are written on the graph below:
You will see
that doubling the concentration of hydrochloric acid also doubles the initial
rate.
Explanation
The question
we need to answer is how come the more concentrated acid reacts faster?
We can say
that increasing the concentration of the acid increases the reaction rate. Reaction rate is proportional to the concentration of the hydrochloric acid.
But to
explain this conclusion more fully we have to think about what is happening to the particles of acid colliding with
the magnesium ribbon.
In this
experiment we have been careful to keep the magnesium ribbon used in each
experiment the same size and mass and surface area.
Only one
factor has been changed: the concentration of hydrochloric acid.
Its
concentration has doubled so that 2M has twice as many acid particles per cm3
as has 1M acid.
At any
particular temperature say 25oC, this means that the chances of hydrochloric
acid particles with sufficient energy colliding with the magnesium ribbon and
reacting has doubled.
There must be
twice as many acid particles in the 2M with sufficient energy to react with the
magnesium ribbon. You see some particles
won’t have enough energy to react they'll be moving too slowly. But for the rate to double there has to be
twice as many with what we call the activation energy that is enough energy to
react with magnesium.


No comments:
Post a Comment