Edexcel A
level Chemistry (2017)
Topic 12:
Acid–Base Equilibria:
Here are
the next two learning objectives:
Explaining Titration Curves
12/16. To be able
to draw and interpret titration curves using all combinations of strong and
weak monobasic acids and bases
12/17. To be able
to select a suitable indicator, using a titration curve and appropriate data
There are four basic types of titration curve in this post I’m just going
to look at the two most interesting:
a) Strong monobasic acid with strong monobasic base
This is the titration curve for a strong monobasic acid
titrated with a strong monobasic base.
We notice that:
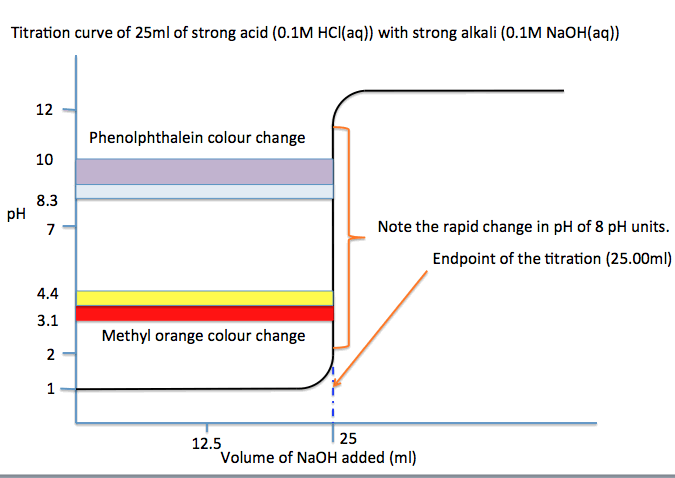
• the titration curve starts at the pH of the strong acid HCl.
• both methyl orange and phenolphthalein could be acid
base indicators since both colours changes occur when pH change is rapid
(vertical part of the “curve”).
• pH changes over 8 units at the end point 25.00ml.
• so we see why only a drop or two at the end point
will turn the indicator colour from acid to alkaline—pH change is rapid at the
end point.
b) Weak monobasic acid with strong monobasic base titration curve:

What we notice is this:
• the curve starts at the pH of 0.1M ethanoic acid
that is pH=2.9
• the curve rises slowly and the pH change levels off
because this is a buffer region.
• why is this a buffer region?
Because [CH3COOH]
= [CH3COO—]
the concentration of undissociated weak acid equals the concentration of
dissociated acid anion, a typical condition for a buffer solution.
• at 12.5ml when the acid is half neutralised the pH = pKa so given the Ka
of ethanoic acid we can say that this pH is – log10 (1.58 × 10⁻⁵)
or 4.8.
• why does pH = pKa at 12.50 ml?
at this point as we see [CH3COOH] = [CH3COO—] so in the Ka
equation both terms will cancel:

Therefore Ka = [H+]
So pKa = pH
• addition of further base destroys the buffer and the
acid is neutralised at 25.00ml the end point of the titration.
• the pH then rises rapidly over about 4 pH units this
time not 8.
• phenolphthalein is one indicator (there are others)
that changes colour over this more limited pH range (7—11) and so it can be
used in a weak acid–strong base titration.


No comments:
Post a Comment